Vehicle Data Cloud Storage, Analysis, Live Display and Interaction
Christian Rathberger
A large number of modern vehicles are almost permanently connected devices, which constantly exchange data with their environment, other vehicles, and cloud services. The obvious applications of this technology start with simple use-cases, such as traffic warnings and routing based on traffic information. Another important area of research is autonomous driving, which is expected to radically transform our experience of mobility within the next decade. This field is being extensively studied and explored. Much less noticeable to the average driver, but of great significance to the automotive industry, is the continuous flow of vehicle driving data to big-data centers at most modern OEMs. This usually anonymous data provides OEMs with information on how their vehicles are used, including the frequency of different load cases and even individual sub-components of the vehicle systems. Analyzing this data allows for a more focused planning of future development steps directly derived from real customer use-cases and needs.
Automotive Internet of Things at Magna
At Magna we have been conducting research and development in similar applications for several years now. As a supplier, one of our primary interests are the load cases our components experience during practical use. However, we encountered some additional requirements, specific use-cases, and applications for related IoT technologies:
- Even though Magna does not act as an OEM, we frequently develop prototypes and technology demonstrators to showcase new products to interested OEM customers.
- For our prototype vehicles it is essential to capture driving data in a comprehensive and safe way, and while early prototypes usually are “rolling laboratories” fully equipped with test- track equipment and a large number of sensors, later prototypes are much closer to series vehicles and are safe to use on public roads. For any type of vehicles we need an unobtrusive and simple way to gather data from the CAN-bus and store it into the cloud for later analysis. With increasing levels of automation, test engineers can now analyze data on a laptop computer from the co-driver’s seat in real-time, making the testing process more efficient and effective.
- For our technology demonstrators, we need easily adaptable extensions of the base vehicle’s native user interface. This can mean read-access to vehicle performance data (e.g. live visualization of torque distribution to all four wheels), but also write-access to vehicle operation modes (e.g. switching between different all-wheel-driving modes). As we want to use these vehicles as showcases for our customers, our marketing demands a professional and modern “look and feel” for the related interfaces and information displays.
- Furthermore, we have the important boundary condition that that our system needs to be easily adaptable to different vehicles from various brands.
Based on this we have developed our Metrix environment with a focus on
- Data cloud storage and subsequent analysis via browser interfaces,
- Live data visualization and vehicle interaction via on-board mobile devices (tablet computers
, mobile phones) and
- Maximal flexibility regarding supported vehicles and vehicle brands.
Architecture of our IoT environment
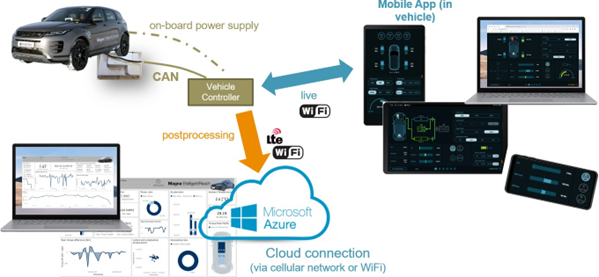
The overall architecture can be split into several key elements, where the only hardware is a small add-on onboard device, which
- acts as a physical interface to various vehicle I/O connections (CAN bus, OBD port, user-
specific sensors…),
- decodes data from these different sources,
- optionally filters this data,
- transforms the filtered data to a standard format,
- transfers this data either to mobile devices for live display or
- sends the data to cloud storage for later analysis in a much more comprehensive scope.
On mobile devices we provide an app which provides standardized charts and diagrams for live data visualization. This can also be adapted to special use-cases and is specifically designed to be suitable for live on-board demonstrations for marketing and management purposes. Additionally, this app allows to actively set parameters for the vehicle if the related functionality is available through the interface.
Our cloud services are hosted publicly and are focused on efficient communication and data security. For future applications with large numbers of separate users, we are currently implementing comprehensive user- and access-management features. In addition to the handling of large quantities of raw data, these services will also be able to perform time-consuming data-analysis continuously in the background. Depending on the use-case (prototype vehicle, car- or commercial vehicle fleet, individual use, etc.) we provide pre-defined analysis routines (e.g. vehicle efficiency analysis, unsafe driver behavior, evaluation of powertrain load-points and their frequency) and allow users to specify their own data analysis functions (e.g. vehicle specific detection of failure modes).
Finally, we provide a web-based user interface to access and analyze the data stored in the cloud. This feature is accessible through any browser, thus it can be used on both desktop computers and mobile devices, and gives a complete overview of the status of cars, trucks or entire fleets.

Figure 1: Magna IoT Environment Architecture
Application and use-cases
The first application we want to mention in this article is the use of our system at our annual Magna winter-testing-days in Arjeplog, Sweden, in early 2022 and 2023. We utilized this event as an opportunity to showcase innovations in powertrain technologies with a specific focus on different all-wheel-drive applications. Obviously, driving on frozen lakes offers excellent possibilities for this purpose.
The main challenge that our marketing team reported was that if the technology works too well, the driving experience feels like driving on a regular road. Therefore, we adapted our vehicle interface to
- allow for dynamic “virtual” settings of different powertrain technologies, enabling our technology demonstrator car to act as a front-wheel-drive, rear-wheel-drive, all-wheel-drive or 4WD drive vehicle on-demand. Furthermore, different variants of torque vectoring can be implemented, making it possible for the driver to experience the impact of various technologies firsthand in a safe test-track environment.
- Additionally, we incorporated a live visualization of torque distribution to all four wheels. This helps us to better understand the system’s operations and the varying speed at which the torque needs to be adapted for each wheel. This enables the intended smooth riding experience and facilitates different driving behaviors of the vehicle in terms of agility, comfort, or traction.
- The UI consists of a multi-page layout and offers a wide range of chart types and presentation formats. This versatility enables users to customize the UI according to their specific needs and ensures that it suits the presentation scenario. As a result, users can easily adapt to different audiences and focus on specific components during the same test trip by utilizing the pre-designed pages.
As second use-case is currently being developed in collaboration with a local public transport provider. Following the goal of decreasing the overall power consumption, the same hardware and software setup is applied and installed in public buses. The available data is collected by accessing the vehicle’s CAN buses directly or through diagnostic interfaces like FMSi. This data is then transmitted to the cloud in order to store the telemetry data. On the one hand, the current values
are presented using an online dashboard to detect and review optimization potential using a variety of available methods. On the other hand, we develop models to automatically classify the recorded trips based on their energy consumption. External factors like weather, influence of the driving behavior, and auxiliary power consumers can also be taken into consideration.

We developed a thermal model of the buses cabin which has been adjusted to fit the actual measured values. The simple model essentially considers the cabin volume and solar effects through windows using our thermal simulation software KULI. With the help of this simple model, we can quantify the change in energy consumption increasing or decreasing temperature, respectively. This serves as a base for decisions regarding a trade-off between passenger comfort and energy cost.
Furthermore, a powertrain model has been developed to accurately behavior of the powertrain using the collected measures. This model enables the identification of optimization opportunities in a controlled environment, where reproducible experiments can be conducted, rather than implementing specific countermeasures directly in the field.

Automated Data Analysis
Significant attention is also given to automated data analysis using statistical methods or even AI- supported machine-learning approaches. This approach uses basic recorded measures such as longitudinal acceleration and measured energy consumption and establishes relationships between these variables such as distance traveled, speed limit and actual speed. In the current development stage, a machine-learning model is trained to classify the efficiency level of the trip into three categories: inefficient, normal and efficient. Initial results show the following effects:
- Inefficient trips tend to have a higher frequency of high acceleration/deceleration events, as well as rapid changes in acceleration/deceleration (jerk).
- Anonymized data reveals a correlation between the driver and the likelihood of being classified as (in)efficient.
- Influences such as time of day or time of week are evident in the data.
- Faster driving does not necessarily result in an inefficient classification, as it can be attributed to a more efficient driving style as well.
The following benefits arise from automated data analysis:
- Continuous analysis of data allows for ongoing monitoring of data, providing fleet operators with transparency and the ability to optimize their fleet efficiently.
- Vehicles can be applied at a route where their characteristics are best suited, resulting in minimized costs.
- Target-oriented driver trainings can be employed to optimize the impact of drivers on energy efficiency.
- Live visualization of relevant data can inform the driver about the current vehicle conditions and provide instant feedback.
- Simulations can be utilized to explore potential optimization opportunities, enabling a faster and more efficient application of optimization by determining specific cause-effect relationships.
Conclusion
The Metrix system has a wide range of applications. It was used during Magna’s testing activities to showcase different powertrain technologies. The vehicle interface allows for dynamic setting of powertrain modes and provides live visualization of torque distribution.
In another use-case, the system was installed in public buses with the goal to reduce power consumption. Data from the buses is recorded and sent to the cloud for analysis. An online dashboard presented real-time data and optimization potential. Models were developed to classify trips based on energy consumption and other factors.
Automated analysis of data using statistical methods and machine-learning revealed insights such as correlations between driver behavior and trip efficiency. The system provided continuous analysis to optimize fleet operations, select optimal routes, and provide real-time information to drivers.
Overall, the system offers versatile applications, enhancing vehicle performance, optimizing energy consumption, and improving decision-making. Future potential for growth and development can be identified, including refining the hardware component, expanding the features of the mobile app, and enhancing analysis capabilities in the cloud. Additionally, there are opportunities to explore new use-cases towards production plants and even beyond the automotive industry.
i Fleet Management System
Christian Rathberger Senior Manager VTM Software & IoT Magna Powertrain


