Erich Ramschak, Gerhard Schagerl

Objective
All driver assistance functions go through a comprehensive public road validation program in a fleet before being launched into the market. The test campaign should cover all the different parameters of driving maneuvers and environment conditions which can occur in practice.
For a validation in e.g., Europe 300.000 up to 1 million fleet kilometers are required depending on the automation level (SAE L0 to L2+) and ODD (operational design domain) specifications. The appropriate test routes for fleet vehicles are optimized on the basis of functional specifications, diverse algorithms of edge case investigations, empirical experience, and occurrence estimations about unpredictable events like e.g., country specific dynamic driving styles or weather.
Need for Improvement
The unforeseen, and unpredictable brings uncertainty to the test campaign as to whether the goal to validate all practical & eventual real-world scenarios can be achieved with the planned test routes. Extensions of the test kilometers provide additional safety to reach these goals, but the additional test kilometers increase the ADAS development cost.
Once the fleet test program begins, a huge amount of test data is generated by the fleet vehicles. This data is distributed over different locations; however the data size of raw signals can be too large for an over-the-air transmission and therefore not directly accessible. Hence, the analysis of raw signals and assessment of test progress is not feasible, and so the uncertainty remains.
The Connected Technology to Optimize Fleet Routes
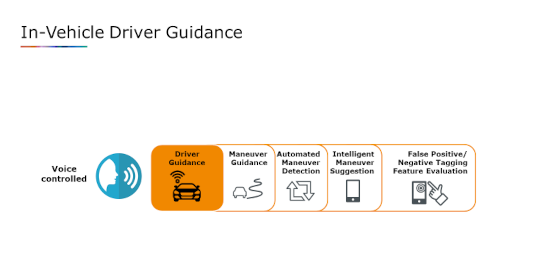
AVL has developed an over-the-air fleet monitoring approach, where selected meta data from the fleet is transmitted in real-time to a data analytics platform on a back-end server. Completely new ways of tracking and operating the fleet are enabled. It allows the direct evaluation of test progress and interactive optimization of route segments during the fleet test campaign. Non-contributing kilometers can be avoided by skipping overfulfilled test scenarios. Finally, this approach includes a smart driver guidance tool in the vehicle which makes a co-driver for ADAS function assessment obsolete.
Hence, this new approach addresses the cost optimization factor at maximum utilization of test routes for the reliable achievement of the targeted validation coverage.
In Vehicle Driver Guidance
Test drivers in the vehicle fleet are supported by a voice-controlled test guidance app on a smart phone or tablet. It assists drivers in guiding them through the test catalogue and provides maneuver suggestions if current test parameters fit to just one of the predefined conditions. For unforeseen events the driver can tag situations which are relevant for further investigation like false negative or positive reactions of ADAS. Since all driver interactions are set to a minimum there is no need for co-drivers as in former fleet tests.
The number and types of processed test maneuvers are continuously transmitted from every vehicle to the backend and allow test coverage analysis over the entire fleet. Whenever fleet vehicles collectively reach the test targets and certain maneuvers are sufficiently covered, the drivers get immediately updated information of the revised test catalogue. Hence, unnecessary maneuvers are avoided but also insufficiently covered maneuvers can be added.
Automated ADAS Performance Evaluation
During a fleet validation the ADAS controller performance is evaluated for market acceptance and end customers perception respectively. For this purpose, AVL applies a technology that automatically triggers assisted driving maneuvers from measurement signals, categorizes them and then evaluates these events on the basis of objective criteria. The measurement signals include information of the ego-vehicle such as speed, acceleration, and target objects such as relative distances to other vehicles, pedestrians or cyclists including road marking information. This metadata is sent via OTA to the backend server for maneuver or scenario evaluation.
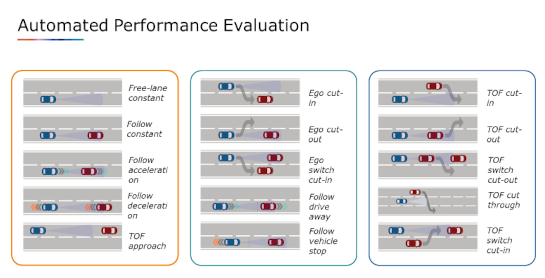
The above picture shows scenarios like single lane maneuvers, follow and lane change maneuvers. All relevant maneuvers are detected automatically, and the key performance indicators (KPI) are calculated based out of physical parameters. The range for the objective performance assessment is a scale from 1 to 10. Higher numbers indicate safer, reliable and more comfortable drive for the end user.
Backend Data Platform for Data Enrichment, Processing and Performance Evaluation
AVL’s data analytics platform processes all data analytics i.e., coverage of test attributes, test progress and evaluation of the ADAS controller performance.https://www.avl.com/-/headquarters-graz
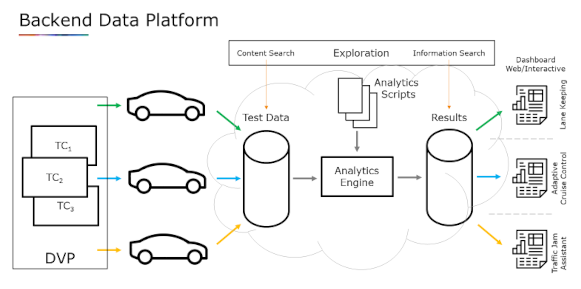
Instant Analytics and insights on the testing progress and the test case coverage show potential overlaps of the testing program and enable synergies to reduce testing effort.
In this tool chain analytics scripts for data aggregation, statistics, event detection and KPI calculation are executed in a powerful and scalable analytics platform to enable automatic processing. Centralizing the analytics scripts enables re-use and clean and proper versioning and governance of code.
An added value of this back-end solution is the ability to enrich measurement data from the fleet with local weather / environmental data as well as high definition (HD) map data in one centralized database, thereby providing expanded analysis capabilities of the fleet test campaign.
Such web-based software solution enables us to achieve the former described targets faster and more reliable. In summary, the following capabilities are covered:
- A completely automated analytics pipeline from data income to the persistent compilation and processing of the test attributes
- Enrichment of measurement data with metadata derived from on-line channels. Examples are:
- Map matching of GPS points onto drivable road segments
- HD map information like road types, traffic signs, curve radius, road gradients, lanes, road markings, topologies, …
- Local weather information at the individual fleet vehicles
- Traffic conditions at the test vehicles e.g., average speed per road segment
- Driver feedback
- Interactive Data Exploration
- Automatic Reporting
With immediate updates on test status, the fleet manager can react to unexpected challenges quickly or can adjust the testing plan on-the-fly to exploit synergies between the test campaigns and further reduce mileage and costs of the fleet operation.
Synergy Battery Approach
Interestingly the described approach can be applied to various other scenarios. For example, we successfully conducted many fleet projects focused on the robustness of diagnosis and calibration, or the reliability of mechanical design. In these cases, the centralized and automated data processing platform creates many synergies between the different functional responsibilities (thermal integration, transmission, calibration, etc.). Each KPI calculation is executed on all test data of each test vehicle and each trip. This leads to a maximal re-use of every mile driven and therefore improves validation coverage for every stakeholder and reduces testing mileage.
Another field of application is the monitoring of the battery range and state of health. In hybrid and fully electrified vehicles the battery is the most expensive component and therefore of special focus. The range of the battery is dependent on the vehicle usage profile, driving styles, routes and ambient conditions. Understanding these influences is crucial for validation purposes and during operation of electrified vehicles.
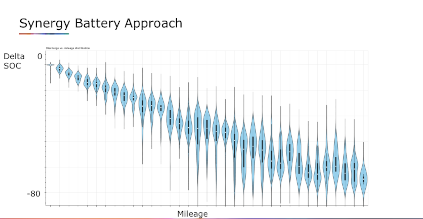
The violin plot shows the big variations of energy used for the same mileage. That means the mileage is depending on many different parameters such as ambients, routes and driving style.
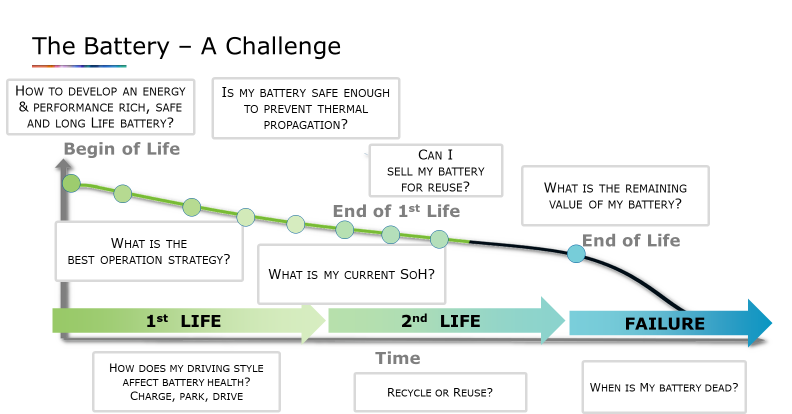
The central data monitoring approach is crucial for monitoring the battery’s health status. Not only during the validation but also along the complete lifetime. With the same KPIs used in validation, the vehicle owners and fleet operators can decide when the best time is for 2nd life battery usage or for battery recycling to optimize TCO.
Summary
This connected approach allows direct test coverage analysis and performance assessment across the entire fleet. The intensive computing power is shifted from the individual fleet vehicles to a central backend server. Extended capabilities like data enrichment via information from on-line channels and high-definition maps improve the value of test campaigns.
In summary this connected fleet validation significantly increases efficiency by, substituting co-drivers in the vehicles, minimizing the human workload for data analysis, and better utilizing the planned driving routes of the entire fleet.
Erich Ramschak & Gerhard Schagerl AVL LIst


